Labor Market And Inflation Drove Stocks Higher
-

-

Published Friday, September 1, 2023 at: 11:51 PM EDT
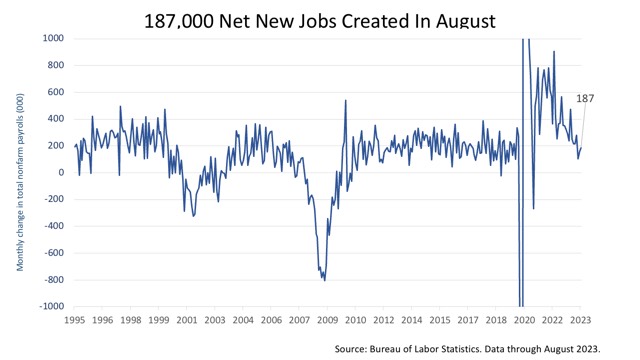
Confirming the economic expansion is unlikely to stop anytime soon, the U.S. economy created 187,000 net new jobs
Wall Street had been expecting the addition of 170,000 new jobs would be created in August, net of jobs lost. The level of job creation is just below the 200,000 monthly net new jobs created in the 11-year economic expansion before the Covid-19 recession in February and March 2020. It’s defied expectations in the face of the most aggressive Federal Reserve monetary tightening campaign in post-War history.
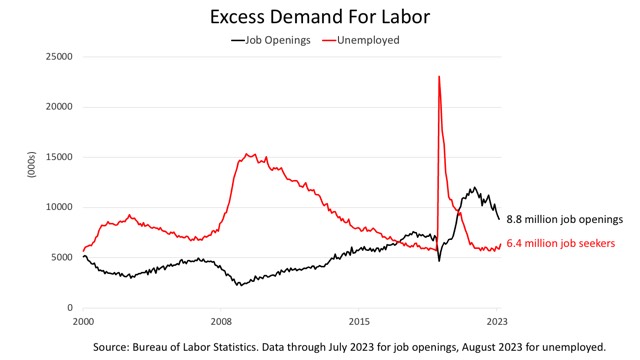
When summer began, roughly two jobs were open for every job seeker – a statistical anomaly caused by the large exodus from the labor force following the pandemic.
The hot job market cooled this summer. The excess demand for labor narrowed, heading back toward normalcy.
The number of job openings came down from 9.6 million in June to 8.8 million in July, a sign the tight monetary policy imposed by the Federal Reserve is curbing growth.
However, the number of job seekers grew from 5.8 million in July to 6.4 million in August. The growth in the number of job seekers is very good news. It means the labor force is growing.
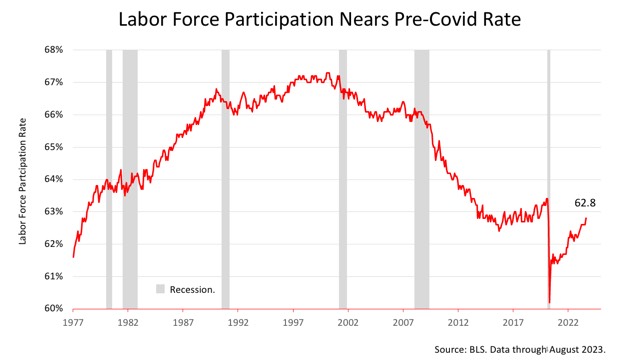
The labor force participation rate collapsed during the pandemic, when the number of people who decided to retire surged after immigration had slowed.
The labor for participation rate is the number of employed plus unemployed as a percentage of the U.S. population age 16 and older. The uptick in August means more Americans are now in the work force. This is very good news, since they will be earning income, spending it, and, thus, growing the U.S. economy.
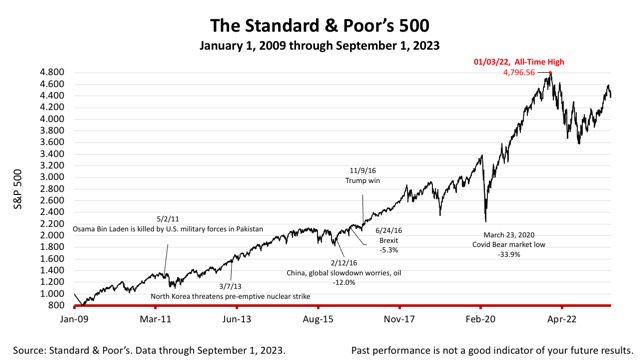
With the latest data on inflation coming in this past week in line with the Federal Reserve’s target range and the labor market strong, the stock market had a very strong week.
The Standard & Poor’s 500 stock index closed Friday at 4515.77, up +0.18% from Thursday, and up +2.5% from a week ago. The index is up +101.83% from the March 23, 2020, bear market low and only -5.85% lower than its January 3, 2022, all-time high.
With sharp gains in stocks in recent months, rebalancing and capital gains management is more important, and the tax outlook makes it prudent to consider converting assets to Roth IRA accounts before the end of the years.
The Standard & Poor's 500 (S&P 500) is an unmanaged group of securities considered to be representative of the stock market in general. It is a market-value weighted index with each stock's weight proportionate to its market value. Index returns do not include fees or expenses. Investing involves risk, including the loss of principal, and past performance is no guarantee of future results. The investment return and principal value of an investment will fluctuate so that an investor's shares, when redeemed, may be worth more or less than their original cost. Current performance may be lower or higher than the performance quoted.
Nothing contained herein is to be considered a solicitation, research material, an investment recommendation, or advice of any kind, and it is subject to change without notice. It does not take into account your investment objectives, financial situation, or particular needs. Product suitability must be independently determined for each individual investor.
This material represents an assessment of the market and economic environment at a specific point in time and is not intended to be a forecast of future events or a guarantee of future results. Forward-looking statements are subject to certain risks and uncertainties. Actual results, performance, or achievements may differ materially from those expressed or implied. Information is based on data gathered from what we believe are reliable sources. It is not guaranteed as to accuracy, does not purport to be complete, and is not intended to be used as a primary basis for investment decisions.
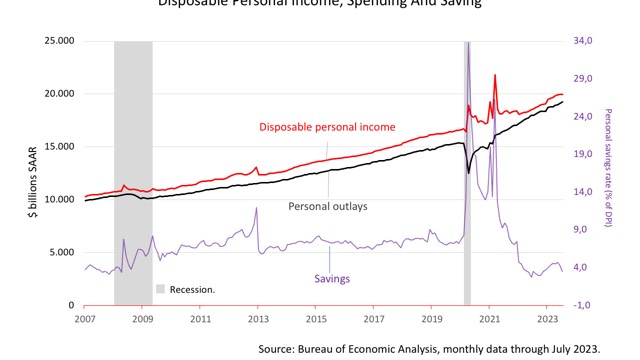
DPI up +7.2% y/y.
Personal outlays up +7.1% y/y.
The savings rate, at 3.5%, is below pre-Covid levels.
Spending down savings

Big week and positive week
More goldilocks
Stock mkt above 4500 which is encouraging
Halthy growth with cooling inf
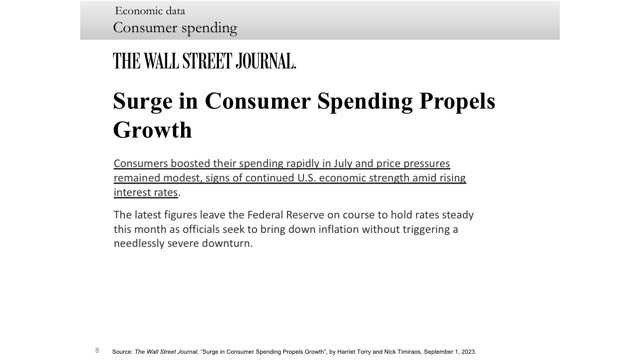
Boosting spending rapidly and price press re,mained modest
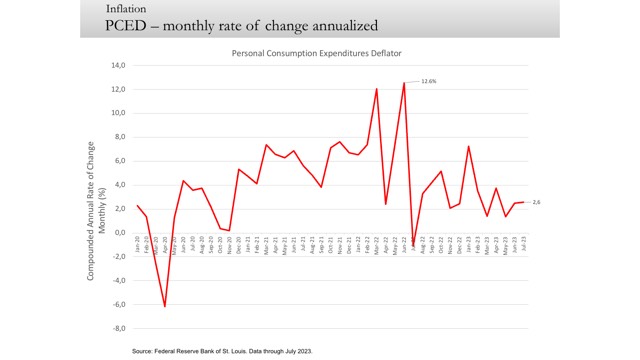
Most recent monthl;y rate annualized
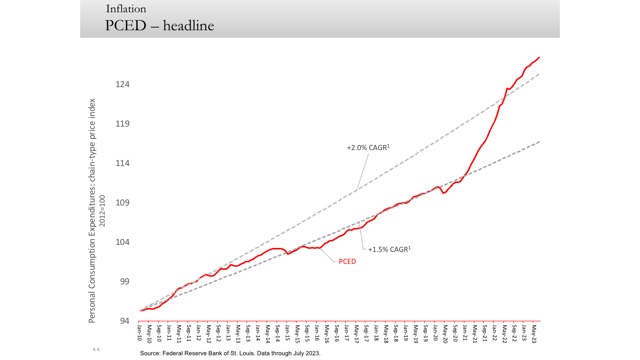
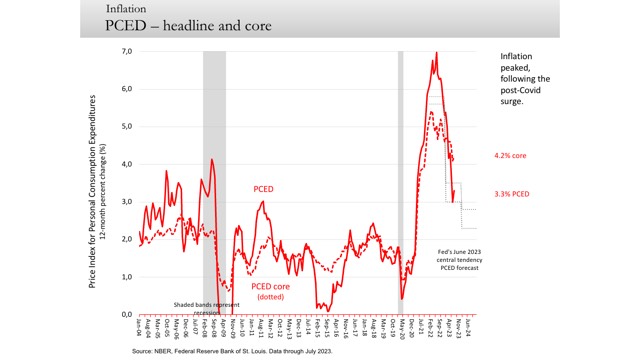
Slope of the red line is bending toward 2% dotted line
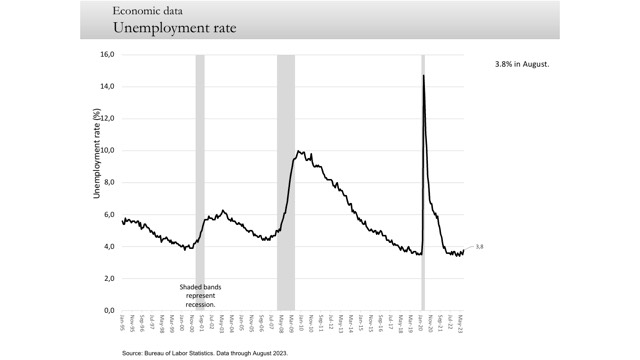
Ticked up from 3.5 to 3.8%
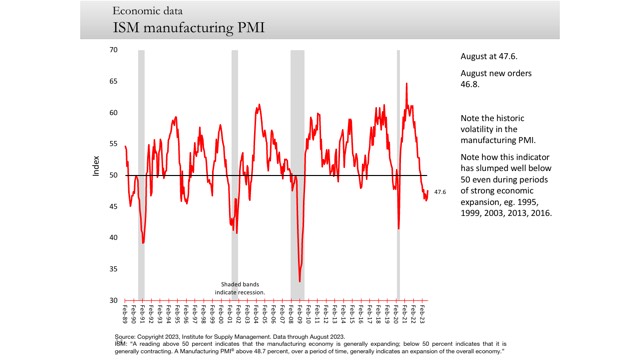
Bottoiming maybe.
The big picture takeaway here is that the ISM manufacturing PMI has historically slumped to a reading under 50 as the economy slides into recession. Also, note the historic volatility of manufacturing momentum within the (grey) periods of economic (GDP) expansion, suggesting that the index has also slipped well below 50 even as the economy has not slipped into recession.
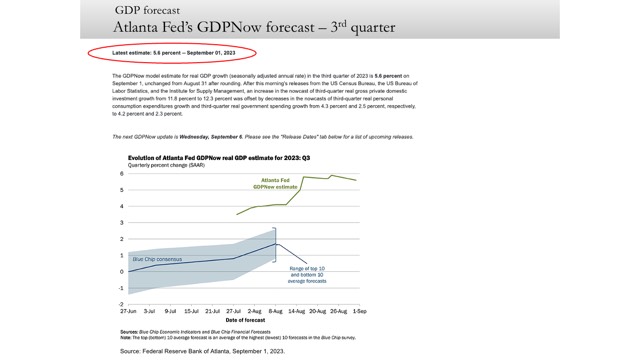
5.6% in 3Q.
Nothing contained herein is to be considered a solicitation, research material, an investment recommendation, or advice of any kind, and it is subject to change without notice. Any investments or strategies referenced herein do not take into account the investment objectives, financial situation or particular needs of any specific person. Product suitability must be independently determined for each individual investor. Tax advice always depends on your particular personal situation and preferences. You should consult the appropriate financial professional regarding your specific circumstances. The material represents an assessment of financial, economic and tax law at a specific point in time and is not intended to be a forecast of future events or a guarantee of future results. Forward-looking statements are subject to certain risks and uncertainties. Actual results, performance, or achievements may differ materially from those expressed or implied. Information is based on data gathered from what we believe are reliable sources. It is not guaranteed as to accuracy, does not purport to be complete, and is not intended to be used as a primary basis for investment decisions. This article was written by a professional financial journalist for Advisor Products and is not intended as legal or investment advice.
This article was written by a veteran financial journalist based on data compiled and analyzed by independent economist, Fritz Meyer. While these are sources we believe to be reliable, the information is not intended to be used as financial advice without consulting a professional about your personal situation. Indices are unmanaged and not available for direct investment. Investments with higher return potential carry greater risk for loss. Past performance is not an indicator of your future results.
2024
-
 Stocks Closed At A Record High
-
 Federal Reserve Projects Strong Growth
-
 The Best People Were Wrong
-
 This Week’s Investment News In Six Charts
-
 U.S. Investor Picture Of The Week
-
 The Conference Board Backs Off Its Recession Forecast
-
 Softening Economic Data, Inflation Fears Dampen Stock Rally
-
 S&P 500 Closes Above 5000 For The First Time Ever
-
 Why America Is The World’s Economic Leader
-
 Investment News For The Week Ended Friday, January 26
-
 Why Stocks Broke The All-Time Record High
-
 A Strategic Update, With Stocks Near All-Time High And Crises Unfolding


")


